dScope Series III Architecture Guide
SIGNAL ANALYZER ARCHITECTURE
The settings and Results of the Signal Analyzer are accessed through the Signal Analyzer, Continuous-Time Detector, FFT Parameters and FFT Detector dialogue boxes.
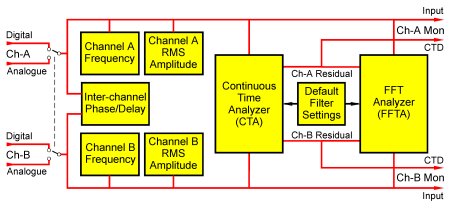
The Signal Analyzer is a two-channel analyzer which is switched to analyze either the analogue or Digital Inputs. There is no hardware restriction which prevents cross-domain (i.e. simultaneous analogue and digital) analysis, but no such functions are currently supported in the dScope software. Cross-domain analysis may be offered in the future.
Measurements of signal frequency and RMS amplitude for both channels, as well as inter-channel phase (or delay) are continuously available in the Signal Analyzer dialogue box (below)

A two-channel Continuous-Time Analyzer (CTA) is also continuously available, and an FFT Analyzer (FFTA) which may be enabled for single or dual channel measurements.
The 'Continuous-Time Analyzer' (CTA) is like a traditional analogue signal analyzer – it can make all the 'standard' measurements, operating continuously so that any momentary change in the input signal is always registered. The dScope has only one CTA (although it operates on both channels simultaneously), so only one type of measurement can be made at a time.

The 'FFT Analyzer' (FFTA) can also make these standard measurements, but it operates differently – by capturing a buffer of samples on activation of an oscilloscope-like trigger. Having captured the buffer of samples, the desired measurement is calculated before re-arming the trigger to capture the next buffer. The FFT Analyzer can perform many more complex functions than the Continuous-Time Analyzer (including calculating 'user-defined' measurements from VBScripts), but its trigger-based nature means that it is slower than the CTA and may miss transitory changes in the input signal which happen between triggerings. The FFTA can calculate up to 40 different (two-channel) Results at once, so it is a powerful way of measuring many parameters simultaneously, for example using multi-tone stimuli as described in the Multi-tone Generation and Analysis section. A sample FFT Detector is shown below:

Another feature of the FFTA is that its buffers can be displayed graphically in the form of Scope Traces in the time domain or FFT Traces in the frequency domain, continuously and without the need to perform Sweeps. This is a powerful diagnostic tool – the provision of a continuous FFT display with up to 256k points and a large dynamic range makes many fault conditions instantly recognisable, where a simple numerical reading would not. A simple example of a trace window display is shown below. This shows a single channel, but dScope can display both channels simultaneously.

The inputs of the FFTA can be switched to analyze the residual outputs of the CTA so that, for example, Scope or FFT Traces of distortion residuals can be displayed.


